GaugeMon
Mac Performance Guide
Check CPU clock speed on an Apple Silicon Mac
Short answer
An Apple Silicon Mac has no single clock speed to look up. Each CPU cluster changes its frequency many times a second with the load, so sysctl hw.cpufrequency prints nothing and System Information lists only the chip and its cores. The live frequency of each cluster comes from sudo powermetrics --samplers cpu_power. Without sudo you can still read the core layout and check whether macOS is holding the CPU back with Low Power Mode or heat.
Step 1: why sysctl prints nothing
On Intel Macs, the hw.cpufrequency keys hold the processor's rated speed in hertz. On Apple Silicon the keys still exist, but they have no value:
sysctl hw.cpufrequency hw.cpufrequency_max; echo "exit status $?"exit status 0That is an M5 Max Mac Studio: sysctl succeeds and prints nothing, not even an error. A key that does not exist fails with sysctl: unknown oid; these are listed but empty:
sysctl -N -a | grep cpufrequencyhw.cpufrequency
hw.cpufrequency_min
hw.cpufrequency_maxThe only frequency sysctl does report is not the CPU's:
sysctl hw.tbfrequencyhw.tbfrequency: 24000000That is the 24 MHz timebase, the counter macOS uses to keep time. Scripts that divide by it or print it as "CPU MHz" are wrong on Apple Silicon.
Step 2: which cores the chip has (no sudo)
System Information gives the chip and the core split, but no speed:
system_profiler SPHardwareDataType | grep -E "Chip|Cores" Chip: Apple M5 Max
Total Number of Cores: 18 (6 Super and 12 Performance)sysctl has the same layout as performance levels, fastest first:
sysctl hw.nperflevels hw.perflevel0.name hw.perflevel0.logicalcpu hw.perflevel1.name hw.perflevel1.logicalcpuhw.nperflevels: 2
hw.perflevel0.name: Super
hw.perflevel0.logicalcpu: 6
hw.perflevel1.name: Performance
hw.perflevel1.logicalcpu: 12M1 to M4 chips name their two levels Performance and Efficiency; this M5 Max names them Super and Performance. Each level runs at its own frequency, and each cluster within a level can run at a different one, so one number for "the CPU" would be wrong most of the time anyway.
Step 3: the live frequency with powermetrics (needs sudo)
powermetrics is the built-in tool that reads the clock. Its man page says it reports the "CPU frequency distribution during the sample". It needs your administrator password:
sudo powermetrics --samplers cpu_power -i 1000 -n 5This takes five samples one second apart. On Apple Silicon, look for each cluster's active frequency and active residency, and the per-CPU frequency lines below them. Add --show-pstates for the full distribution of frequency steps, which the man page says is "only available on certain hardware".
Read the numbers with the load in mind. The man page explains that frequencies "vary due to the operating system's demand based dynamic voltage and frequency scaling": an idle cluster sits at a low frequency, and that is normal, not a fault. To see the top speed, run something that keeps every core busy and sample while it runs. A frequency that falls while the load stays the same is the Mac throttling; see Check if your Mac is thermal throttling.
Step 4: is something holding the CPU back? (no sudo)
Low Power Mode is the setting most likely to keep the CPU slower than you expect. Apple's About Power Modes on your Mac says "Low Power Mode reduces energy use to increase battery life", and that you choose it in System Settings under Battery, or Energy on desktop Macs. Check it from the terminal:
pmset -g | grep -i powermode lowpowermode 00 is off. 1 means Low Power Mode is on for the current power source.
Heat is the other reason. Both of these work without sudo:
pmset -g thermNote: No thermal warning level has been recorded
Note: No performance warning level has been recorded
Note: No CPU power status has been recordedosascript -l JavaScript -e 'ObjC.import("Foundation"); $.NSProcessInfo.processInfo.thermalState'0No warnings and a thermal state of 0 (nominal) mean macOS is not slowing the Mac for heat. If both are clean and Low Power Mode is off, a low frequency just means the CPU has little to do.
The easier way: GaugeMon
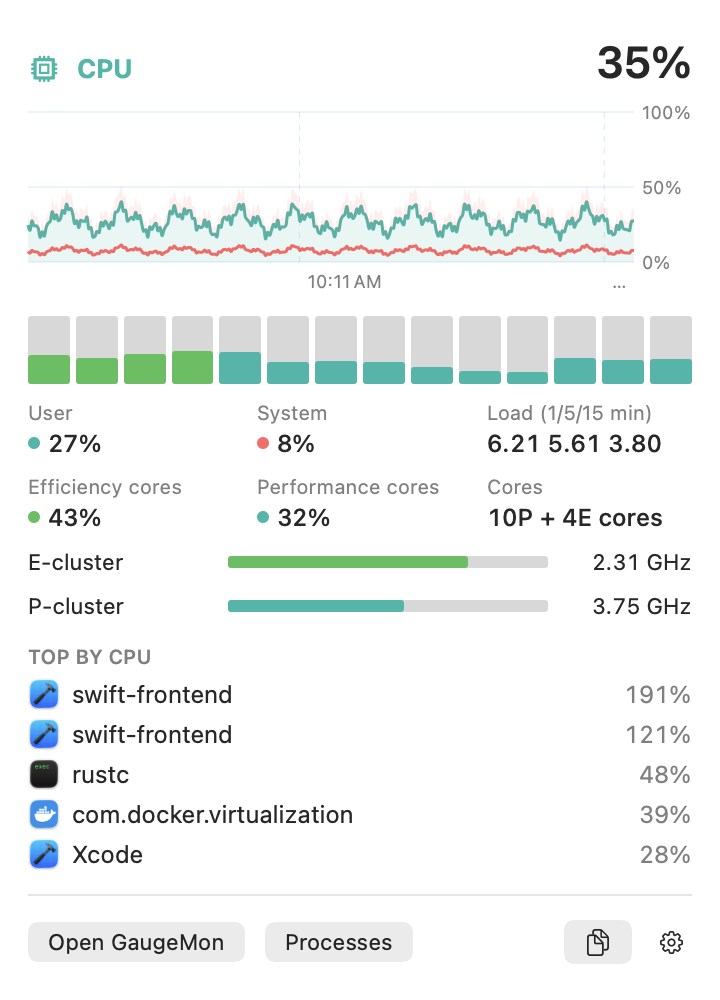
GaugeMon shows each CPU cluster's frequency without sudo. Click the CPU gauge for a meter per cluster with how busy it is and its current frequency, and pick Frequency in the chart picker to follow it over time, so you can watch the clock rise under load and step down when the Mac gets hot. The GPU gauge shows the GPU's frequency the same way. Frequency needs Apple Silicon.