 GaugeMon
Documentation & Support
GaugeMon Help
Installation
Download GaugeMon.dmg, open it, and drag GaugeMon into /Applications. Launch it once from Applications or Spotlight; its gauges appear in the menu bar.
Or install with Homebrew:
GaugeMon requires macOS 14 (Sonoma) or later. Power, CPU and GPU frequency, and temperature gauges need Apple Silicon (M1 or later). On Intel Macs GaugeMon shows CPU, GPU, memory, network, disk, fans and battery.
Arranging the menu bar
Open Settings and choose Menu Bar. Add any of the nine gauges (CPU, GPU, Memory, Power, Temperature, Fans, Network, Disk, Battery) and drag them into the order you want; the preview at the top updates as you go.
- Style: value, graph, bar, ring, or per-core bars for CPU.
- Caption: an optional short label such as "CPU" or "MEM".
- Colour: monochrome, colour when high, or always coloured.
- Layout: each gauge as its own menu bar item, or all combined into one.
- Units: °C or °F. How often GaugeMon samples (every 1, 2 or 5 seconds; 2 by default) is under General.
Gauges your Mac cannot show, such as fans on a MacBook Air, are hidden.

Popovers and the window
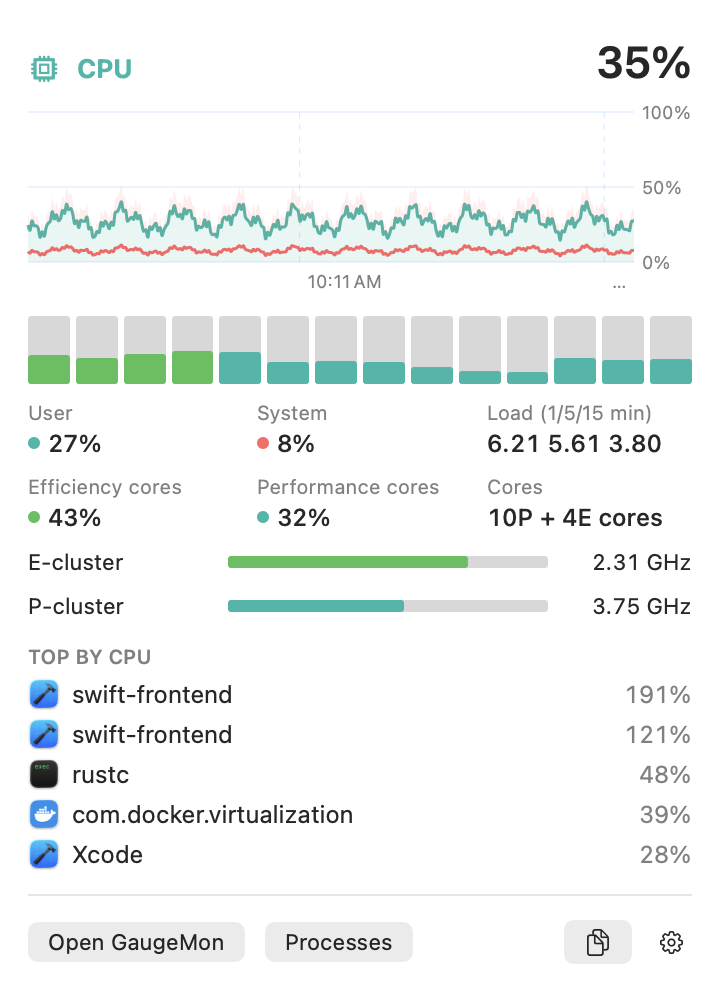
Click any gauge for its popover: the big number, a chart of the last 10 minutes, a breakdown, and the top five processes for that gauge. Open GaugeMon at the bottom opens the window.
The window's sidebar has Overview, every gauge as a card with its chart plus your chip and core layout; Processes, the htop-style list; and a page for each gauge with a larger chart and more of its top processes.
The process list
Click a column header to sort. Columns: Name, CPU %, Memory (physical footprint, the same measure Activity Monitor uses), Power (watts per process, from the kernel's energy accounting), Threads, Disk read/s, Disk write/s, Wakeups/s, CPU time, PID, User and Kind (Apple, or Intel under Rosetta).
- ⌘F filter by name
- ⌘T toggle tree view (parents and children)
- ⌘⌫ quit the selected process; ⌥⌘⌫ force quit it
The inspector shows the executable path, arguments (with secrets masked), working directory, parent chain and start time. The actions menu offers Quit (SIGTERM), Force Quit (SIGKILL), Interrupt, Hang Up, Pause (SIGSTOP) and Resume (SIGCONT), each with a confirmation. Before sending anything GaugeMon checks, by start time, that the PID still belongs to the process you picked.
Copy Summary puts a plain-text snapshot of the gauges and top processes on the clipboard, ready to paste into Slack or a bug report.
The optional helper
macOS only lets a process read CPU and memory counters for processes owned by the same user. Without the helper, GaugeMon still lists every process, but the numbers for processes owned by root and other system users (WindowServer, mds_stores, kernel_task and friends) are not available, and you cannot quit them.
To fill them in, open Settings → Processes and install the helper; macOS asks you to approve it. The helper does two things only: it reads process counters, and it sends one of the six signals above to a process that is still the one you picked. It does not run commands, read files or talk to the network.
To remove it, uninstall it from the same place in Settings.
FAQ
Can't I do all of this from the command line?
Mostly, yes, and the guides show how. top and ps are installed setuid root, so they see every process. htop needs sudo for other users' processes. Power and frequency numbers come from sudo powermetrics. There is no built-in command for CPU temperature or fan speed on Apple Silicon. GaugeMon puts all of it in one place without sudo.
Why does the helper need root?
Because reading another user's process counters, or signalling their process, is exactly what macOS reserves for root. The helper is kept small so that what runs as root is easy to reason about: read counters, send a signal after checking the process identity. Nothing else.
Why is GaugeMon not in the App Store?
The App Store sandbox forbids the privileged helper and reading the SMC and IOReport, which is where power, fan and frequency numbers come from.
Why do the numbers differ slightly from Activity Monitor?
Rates like CPU %, disk and network are averages over a sampling interval, and two apps never sample at exactly the same moments or over the same interval, so bursty processes read differently. Memory uses the same physical footprint as Activity Monitor and should match closely. Activity Monitor's Energy Impact is a relative score; GaugeMon's Power column is watts, so they are not directly comparable.
Does GaugeMon use much CPU itself?
It samples only what is on screen. With the window closed only the menu bar gauges are read, every 2 seconds by default. Processes are only sampled while a process list is visible.
Licensing & trial
GaugeMon has a 14-day fully unrestricted trial with no sign-up. After the trial every gauge and the process list keep working; editing the menu bar layout and quitting or signalling processes need a license.
A license is $19.99 once, covers up to 3 Macs, and includes 12 months of updates. After that GaugeMon keeps working; an optional $9/year renewal extends updates. To move a license to a new Mac, deactivate the old one in the customer portal.
Uninstalling
If you installed the helper, first uninstall it from Settings; that removes it completely, with no Terminal commands needed. Then quit GaugeMon and delete GaugeMon.app from /Applications, or, if you used Homebrew:
To remove stored preferences, delete ~/Library/Preferences/com.suresk.gaugemon.plist.
Support
Email [email protected] or open an issue on GitHub. Copy Summary output is a great thing to include.