GaugeMon
Mac Performance Guide
Check memory usage per process from the Mac terminal
Short answer
Run top -l 1 -o mem -n 10 -stats pid,command,mem,cmprs,purg. The MEM column is each process's physical memory footprint, the same number Activity Monitor's Memory column shows. ps -eo rss gives a different number, RSS, which counts shared pages that every process maps and ignores memory macOS has compressed, so it reads high for some processes and low for others. For the whole Mac use vm_stat, memory_pressure and sysctl vm.swapusage.
top: processes by footprint
Memory, unlike CPU, is a snapshot rather than a rate, so one sample is enough:
top -l 1 -o mem -n 8 -stats pid,command,mem,cmprs,purg | tail -9PID COMMAND MEM CMPRS PURG
32186 rustrover 2949M 808M 0B
3678 datagrip 1844M 266M 67M
3665 ghostty 1814M 502M 4608K
606 WindowServer 1806M 588M 24M
3680 zoom.us 1494M 540M 112K
34614 Postman Helper ( 1078M 928M 0B
3667 Messages 793M 510M 0B
21751 Google Chrome He 775M 123M 0Bman top defines MEM as the "physical memory footprint of the process": the pages it is responsible for, including the ones macOS has compressed (CMPRS) and, on Apple Silicon, the GPU memory it owns, since CPU and GPU share one pool. PURG is purgeable memory the process has said macOS may drop. Leave off -l 1 to watch it live, sorted by memory, and top -pid 32186 -stats pid,command,mem,cmprs follows one process. The process name is cut to 16 characters; ps -p 34614 -o command= shows the full one.
ps: RSS, and why it disagrees
ps can print each process's resident set size in kilobytes, with the full path, which top cannot:
ps -eo rss,comm | sort -rn | head -52794208 /Applications/RustRover.app/Contents/MacOS/rustrover
1634192 /Applications/DataGrip.app/Contents/MacOS/datagrip
821232 /Applications/Google Chrome.app/Contents/Frameworks/Google Chrome Framework.framework/Versions/154.0.8037.57/Helpers/Google Chrome Helper (Renderer).app/Contents/MacOS/Google Chrome Helper (Renderer)
758576 /Applications/Google Chrome.app/Contents/MacOS/Google ChromeRSS is every page currently resident in RAM that the process has mapped. That is a different question from footprint, in two ways:
- It counts shared pages in full. System frameworks live in the shared cache and are mapped by nearly every process, so each one's RSS includes the same physical pages. Add RSS across processes and the total is not memory in use; it can exceed the RAM in the Mac. A VM or anything that maps a big shared region reads high: Docker's VM on this Mac had an RSS of 3.0 GB at the same moment top put its footprint at 1.76 GB.
- It ignores compressed memory. Pages macOS has compressed are no longer resident, so an idle app that has been squeezed reads low. RustRover, idle for an hour, had an RSS of 1.86 GB while its footprint was 2.95 GB, 1.7 GB of that compressed. Wake it up and the RSS climbs with no new allocation.
So RSS is fine for "is this process growing?" over time, and poor for comparing processes or adding them up. ps -m claims to sort by memory but does not order by RSS on current macOS; pipe through sort as above.
footprint: one process in detail
macOS ships a footprint command that explains where a process's footprint comes from. It takes a PID or -p with a name:
footprint -p rustrover======================================================================
rustrover [32186]: 64-bit Footprint: 2949 MB (16384 bytes per page)
======================================================================
Dirty Clean Reclaimable Regions Category
--- --- --- --- ---
2218 MB 0 B 0 B 8005 untagged (VM_ALLOCATE)
605 MB 0 B 0 B 178 MALLOC_SMALL
36 MB 0 B 0 B 83 Owned physical footprint (unmapped) (graphics)
32 MB 0 B 0 B 39 IOSurfaceThe headline matches top. The categories tell you whether the memory is the heap (MALLOC), a runtime's own regions (the JVM's heap shows up as untagged VM_ALLOCATE), graphics surfaces, or stacks. footprint --swapped adds a column for how much is compressed or swapped. vmmap --summary 32186 | grep footprint gives the same total plus the peak. Without sudo both work only for your own processes; footprint 606 for WindowServer answers "try as root?", the same rule that makes htop show 0% for root's processes.
The whole Mac: vm_stat, memory_pressure and swap
vm_statMach Virtual Memory Statistics: (page size of 16384 bytes)
Pages free: 20072.
Pages active: 1024159.
Pages inactive: 1012134.
Pages wired down: 373924.
File-backed pages: 558928.
Anonymous pages: 1488690.
Pages occupied by compressor: 644091.Everything is in pages; multiply by the page size on the first line (16 KB on Apple Silicon, 4 KB on Intel). Those lines map onto Activity Monitor's Memory tab on a 48 GB Mac like this:
- Wired Memory = pages wired down: 373,924 × 16 KB = 5.7 GB.
- Compressed = pages occupied by compressor: 644,091 × 16 KB = 9.8 GB (what they held before compression is "Pages stored in compressor", 2.27 million, 34.6 GB).
- App Memory is close to anonymous pages: 1,488,690 × 16 KB = 22.7 GB.
- Cached Files = file-backed pages: 558,928 × 16 KB = 8.5 GB.
Apple defines Memory Used as app memory plus wired plus compressed, about 38 GB here. top's header line said PhysMem: 47G used, 489M unused at the same moment because it counts cached files as used, and they are: macOS fills idle RAM with file cache it can drop instantly. That is why the two commands that report pressure matter more than any "used" number:
memory_pressure | tail -1; sysctl vm.swapusage kern.memorystatus_vm_pressure_levelSystem-wide memory free percentage: 66%
vm.swapusage: total = 8192.00M used = 6684.31M free = 1507.69M (encrypted)
kern.memorystatus_vm_pressure_level: 166% free with 489 MB unused is not a contradiction: free here means reclaimable without hurting anything. Pressure level 1 is normal, 2 warning, 4 critical. Mac memory pressure yellow/red explains what to do when it is not 1, and High swap usage on Mac covers the swap line.
The easier way: GaugeMon
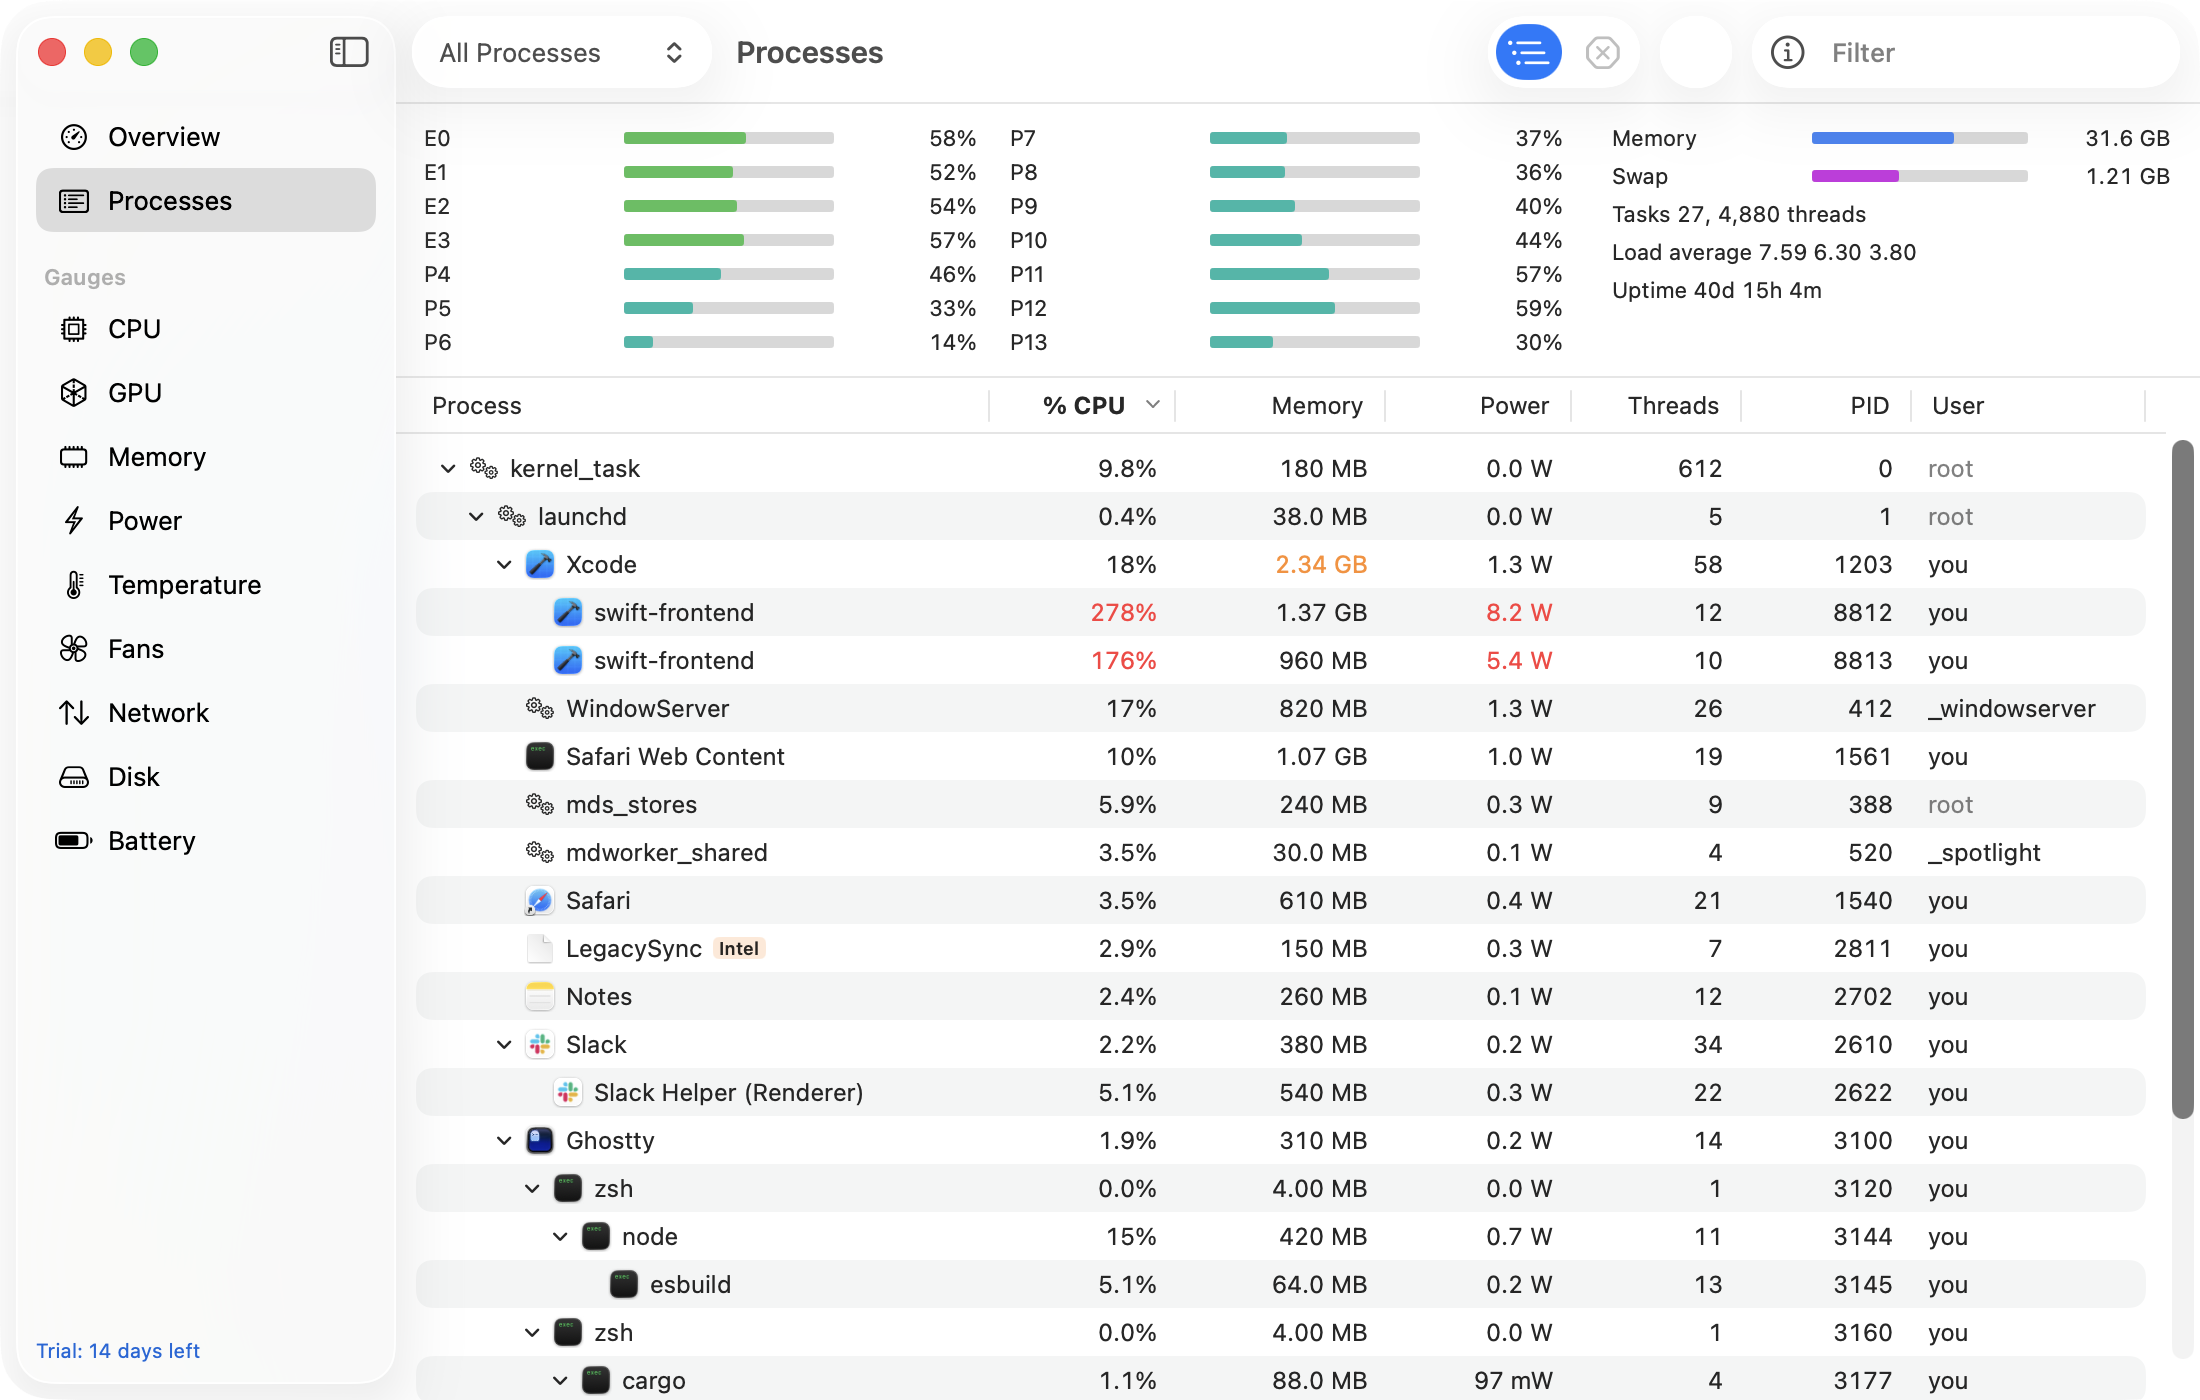
GaugeMon's Memory gauge sits in the menu bar; click it for app, wired, compressed and cached memory, swap, pressure, a chart of the last 10 minutes and the five largest processes by physical footprint, the same measure as top's MEM column and Activity Monitor. The Processes window sorts every process by Memory, and the optional helper fills in root's processes, which footprint and vmmap cannot read without sudo.