GaugeMon
Mac Performance Guide
Check if your Mac is thermal throttling
Short answer
Run pmset -g therm. If it prints "No thermal warning level has been recorded" and "No performance warning level has been recorded", macOS has not slowed the Mac down for heat. To ask macOS directly for its current thermal state, which works the same on Apple Silicon and Intel and needs no sudo, run the one-line osascript command below: 0 means nominal, and anything higher means the Mac is hot enough to be cutting back.
Step 1: pmset -g therm (no sudo)
pmset -g thermNote: No thermal warning level has been recorded
Note: No performance warning level has been recorded
Note: No CPU power status has been recordedThat is a Mac that is not throttling, here on an M4 Max. When macOS has recorded a problem, the matching line is replaced with a number, as Thermal Warning Level = or Performance Warning Level = followed by the level.
The third line, the CPU power status, is where Intel Macs show throttling most clearly. When it has been recorded it lists three limits, defined in Apple's IOKit headers:
CPU_Speed_Limit: the CPU's maximum speed as a percentage. 100 is full speed; 60 means the CPU is held to 60% of its maximum.CPU_Scheduler_Limit: the percentage of CPU time available. 100 is normal.CPU_Available_CPUs: how many CPUs are online. A number below your core count means some were taken offline.
Do not expect those fields on Apple Silicon. Apple Silicon Macs throttle by lowering the clock of each CPU cluster, and the reliable way to see it there is the thermal state or powermetrics, below.
To watch for changes while you reproduce the slowdown, use the log form. It prints the current state, then a new entry each time it changes, until you press Control-C:
pmset -g thermlogStep 2: the thermal state (no sudo, Apple Silicon and Intel)
macOS publishes a single thermal state to apps so they can slow down when the Mac is hot. You can read it from the terminal with JavaScript for Automation:
osascript -l JavaScript -e 'ObjC.import("Foundation"); $.NSProcessInfo.processInfo.thermalState'0Apple's documentation for NSProcessInfo defines the four values:
0Nominal: no action needed.1Fair: fans may become audible.2Serious: fans at maximum, performance may be impacted.3Critical: performance significantly impacted, the Mac needs to cool down.
Serious or critical while a long job is running is thermal throttling.
Step 3: powermetrics (needs sudo)
For a second opinion, powermetrics reports the thermal pressure level. It needs your administrator password:
sudo powermetrics --samplers thermal -n 1Look for the line Current pressure level:. The levels it can report are Nominal, Moderate, Heavy, Trapping and Sleeping; anything above Nominal means the system is under thermal pressure. It is a single reading at the end of the sample, so take several during the slow period.
To see the throttling itself, the cpu_power sampler reports CPU frequencies; on Apple Silicon it shows the active frequency of each CPU cluster. A frequency that sinks while the load stays the same is the throttle at work:
sudo powermetrics --samplers cpu_power,thermal -i 2000 -n 5On Apple Silicon, powermetrics does not print CPU temperatures; it only gives the pressure level. On Intel Macs its smc sampler includes CPU die temperature and fan speed.
Signs in Activity Monitor
Activity Monitor has no throttling indicator, but a few things point to it:
kernel_taskclimbs in the CPU tab while the Mac is hot. macOS uses it to take CPU time away from other processes; see kernel_task using high CPU on Mac.- The same job takes longer each time you run it back to back, while its % CPU stays the same or drops.
- The fans are loud (on Macs that have them), and the CPU History window (Window > CPU History) stays full while the work gets slower.
High CPU on its own is not throttling. A Mac at 100% on every core with a nominal thermal state is simply busy.
If it is throttling
- Give it air: a hard, flat surface with the vents clear, not a bed or a sofa.
- Find what is producing the heat with
top -o cpuand quit what you do not need. - An Apple Silicon MacBook Air has no fan and is designed to slow down under long, heavy loads. That is expected, not a fault.
- If an Intel Mac reports a low
CPU_Speed_Limitwhile idle and cool, the fans or sensors may need service.
The easier way: GaugeMon
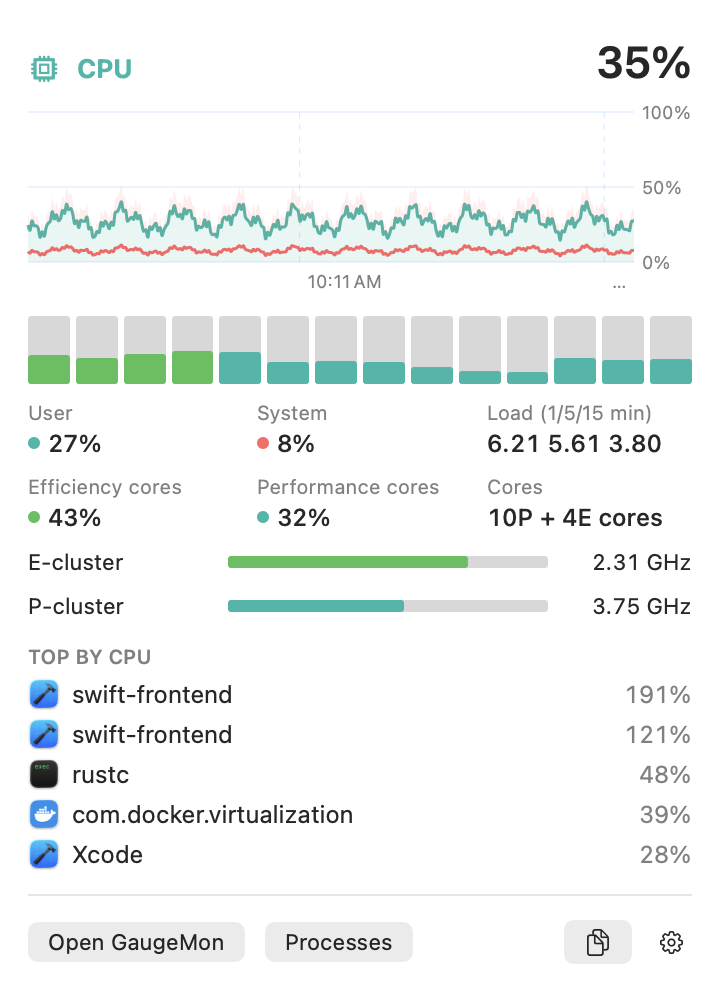
GaugeMon keeps the CPU temperature in your menu bar, so you see the Mac heating up before it slows down. Click the Temperature gauge for every sensor, the hottest CPU and GPU readings, and macOS’s thermal state; the CPU gauge charts each cluster’s frequency, so a throttle shows as the line stepping down. Temperature and frequency need Apple Silicon.