GaugeMon
Mac Performance Guide
Mac fans loud but Activity Monitor shows nothing
Short answer
Fans respond to heat, and heat lags the work that caused it. By the time you open Activity Monitor the process that heated the Mac has usually finished, or the load is on the GPU, which the CPU tab does not show at all. Check whether macOS thinks the Mac is hot, sample top twice to catch short bursts, read GPU utilization, then rule out the external display, the charger and blocked vents. None of it needs sudo.
Step 1: is the Mac actually hot?
Two commands say whether macOS has registered heat, as opposed to the fan simply being audible:
pmset -g thermNote: No thermal warning level has been recorded
Note: No performance warning level has been recordedosascript -l JavaScript -e 'ObjC.import("Foundation"); $.NSProcessInfo.processInfo.thermalState'0That is an M4 Max MacBook Pro at idle. The thermal state goes 0 nominal, 1 fair (Apple's own description: fans may become audible), 2 serious, 3 critical. If yours prints 1 or more, the fans are doing their job and the question is what made the heat. If it prints 0, the Mac has already cooled and the fans are winding down, or something other than load is driving them (steps 5 and 6). Check if your Mac is thermal throttling covers what these commands report on Intel.
Step 2: the process already finished
Activity Monitor refreshes every five seconds by default and shows only the current sample. A Spotlight burst after a download, a Time Machine backup, Photos analysing a library, an Xcode index or an MDM agent's scan can push several cores for two minutes, and the fans keep running for a minute or more after it stops. Sample top twice; the first sample of top -l reports 0.0% for everything, so always ask for two:
top -l 2 -n 8 -o cpu -stats pid,command,cpu | tail -9PID COMMAND %CPU
43472 io.kandji.Kandji 24.7
558 mds 24.0
61057 mds_stores 23.0
0 kernel_task 16.3
606 WindowServer 15.9
55036 2.1.295 14.8
58205 top 8.8
39849 trustd 7.3On this Mac, a device-management agent and Spotlight were the burst. Thirty seconds later all three were back at zero, which is exactly the "nothing in Activity Monitor" experience. Two more ways to see what was busy a moment ago:
- Activity Monitor's Energy tab has a 12 hr Power column on laptops: it ranks processes by what they have used over the last twelve hours, so a job that finished still shows up. The terminal equivalent ranks by current power only:
top -l 2 -n 5 -o power -stats pid,command,power | tail -6. - Check View > All Processes rather than My Processes, otherwise root's daemons such as
mds_storesandbackupdare missing from the list.tmutil statusprintsRunning = 1while a backup is in progress.
Step 3: the load is on the GPU
The CPU tab says nothing about the GPU, and on Apple Silicon the GPU shares the same chip and the same cooling. A video call, screen sharing, a page full of WebGL or canvas animation, a video export, a local ML model or a game can keep the GPU busy with low CPU numbers. Activity Monitor shows it under Window > GPU History; the terminal can read the same counter without sudo:
ioreg -rc IOAccelerator | grep -o '"Device Utilization %"=[0-9]*'"Device Utilization %"=5A number that stays above 50 while nothing is obviously running is your answer. See Check GPU usage on a Mac for finding the process.
Step 4: the external display and clamshell mode
Every frame on every display is composed by WindowServer and drawn by the GPU, and a 5K or ultrawide display at a high refresh rate is a constant background load that is easy to forget. List what is connected:
system_profiler SPDisplaysDataType | grep -E 'Display Type|Resolution' Resolution: 5120 x 1440
Display Type: Built-in Liquid Retina XDR Display
Resolution: 3456 x 2234 RetinaIn clamshell mode the lid traps the top case's heat and the fans have to do all the cooling, so the same load runs warmer than it does with the lid open. If the fans are loud only when docked, try the lid open or a lower refresh rate. WindowServer high CPU on Mac goes into what makes drawing expensive.
Step 5: charging
Fast charging a MacBook from a low battery produces heat in the battery, which sits right next to the logic board, and the fans may run with an empty CPU tab until the charge passes about 80%. Check:
pmset -g battNow drawing from 'AC Power'
-InternalBattery-0 (id=35586147) 100%; charged; 0:00 remaining present: truepmset -g ac | grep -E 'Wattage|Adapter Name' Wattage = 140W
Adapter Name = 140W USB-C Power AdapterIf the battery is charging and warm, wait it out. Charging during a long build or export is the worst case; plug in before it, not during.
Step 6: vents, dust and the SMC
- Blocked intake. A MacBook on a bed, a cushion or a lap pulls less air through the hinge vents. A hard, flat surface or a stand fixes it; so does a cooler room.
- Dust. After a few years the fan must spin faster to move the same air through a clogged heatsink. The sign is a Mac that is loud at modest loads it used to handle quietly. A cleaning restores the margin.
- Intel Macs: the SMC. The System Management Controller runs the fans on Intel Macs, and a fan stuck at full speed while the Mac is cool is a classic SMC fault. Shut down and reset it; Apple's support article has the key sequence for your model. Apple Silicon Macs have no SMC reset; shutting down for 30 seconds is the equivalent.
- Still loud with thermal state 0, a cool case and nothing running? Run Apple Diagnostics (hold the power button at startup on Apple Silicon, or the D key on Intel). A bad fan or temperature sensor shows up there.
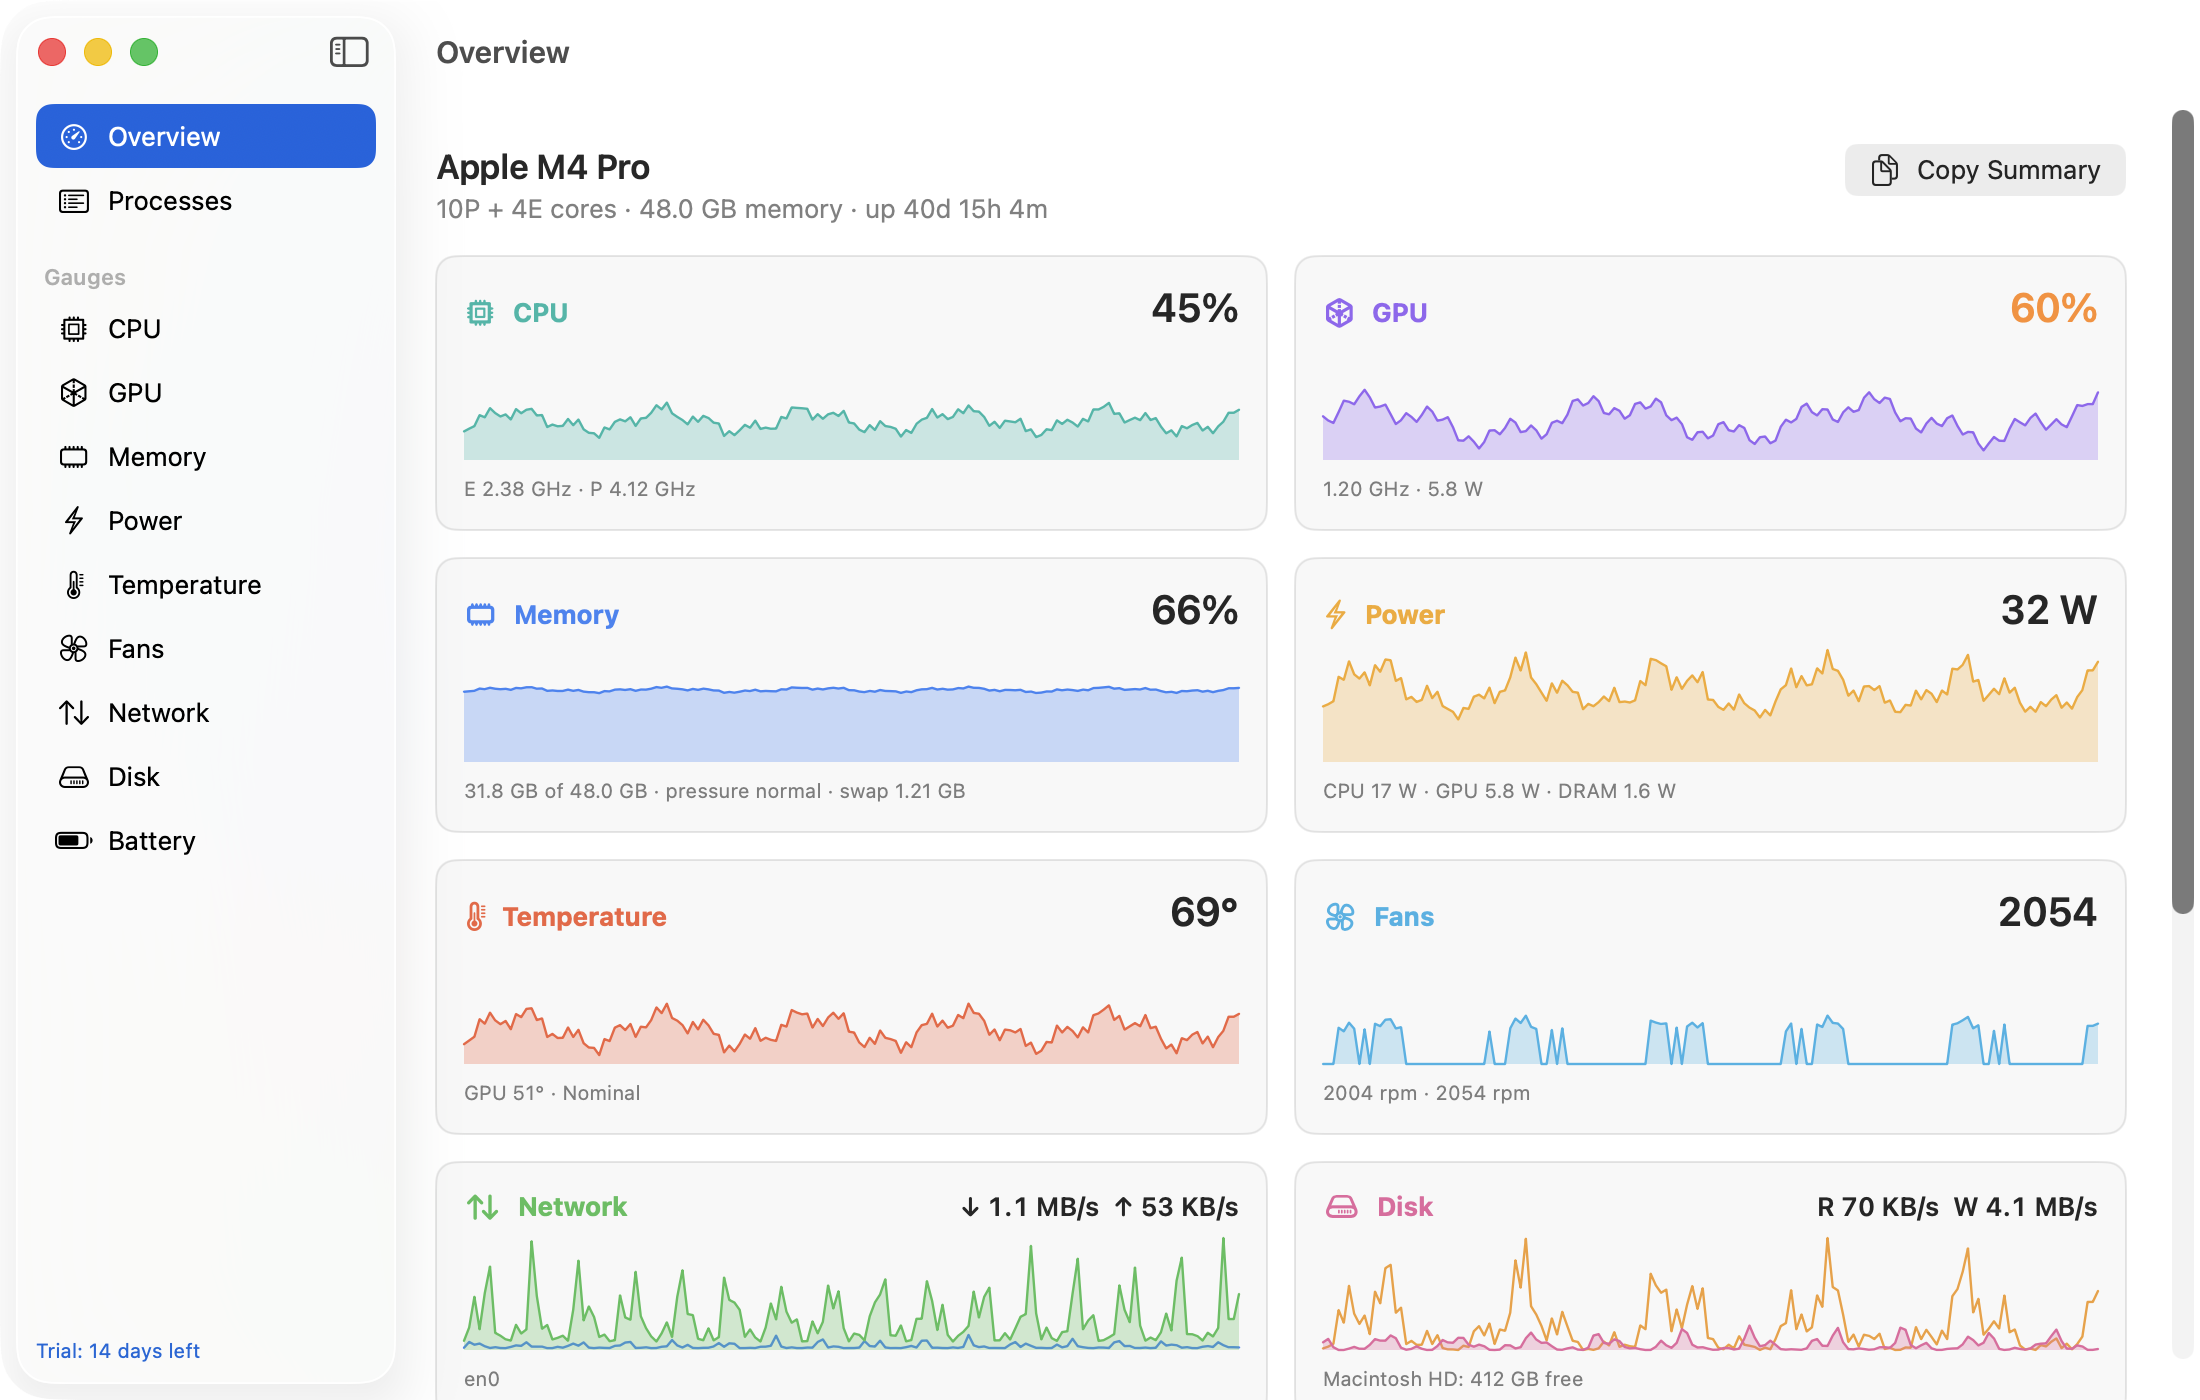
The easier way: GaugeMon
GaugeMon keeps Temperature, Fans, GPU and CPU in the menu bar, read from the sensors, the SMC and IOKit without sudo. Click any gauge for a chart of the last 10 minutes, so the burst that ended before you could open Activity Monitor is still on screen, with the top processes for that gauge. The Processes window has a Power column in watts, which is what makes heat; the optional helper fills it in for root's daemons too.