GaugeMon
Mac Performance Guide
Why a Mac process shows more than 100% CPU
Short answer
On a Mac, the % CPU for a process in top, ps, htop and Activity Monitor is counted per core: 100% means one core fully busy. A process with several busy threads can show 200%, 400% or more. The ceiling is 100% times the number of cores. It is not a bug, and on its own it is not a problem.
How many cores your Mac has
sysctl hw.ncpu hw.physicalcpu hw.logicalcpuhw.ncpu: 16
hw.physicalcpu: 16
hw.logicalcpu: 16This M4 Max has 16 cores, so one process can reach 1600%. Apple Silicon has no hyperthreading, so the physical and logical counts match. On an Intel Mac with Hyper-Threading, hw.logicalcpu is twice hw.physicalcpu, and the percentages count logical CPUs.
On Apple Silicon you can also see the split between performance and efficiency cores:
sysctl hw.perflevel0.name hw.perflevel0.physicalcpu hw.perflevel1.name hw.perflevel1.physicalcpuhw.perflevel0.name: Performance
hw.perflevel0.physicalcpu: 12
hw.perflevel1.name: Efficiency
hw.perflevel1.physicalcpu: 4See it for yourself
Here a small test program starts four threads that each spin on one core. ps sorted by CPU (-r) shows it near 400%:
ps -axo pid,%cpu,comm -r | head -5 PID %CPU COMM
48174 397.6 ./spin4ps -M breaks a process down by thread. Replace 12345 with the PID from the list:
ps -M -p 12345USER PID TT %CPU STAT PRI STIME UTIME COMMAND
suresk 48174 ?? 0.0 S 31T 0:00.00 0:00.00 ./spin4 4
48174 100.0 R 31T 0:00.01 0:04.08
48174 98.5 R 31T 0:00.01 0:04.07
48174 100.0 R 31T 0:00.01 0:04.07
48174 99.1 R 31T 0:00.01 0:04.07 Four threads at about 100% each add up to about 400%. The main thread is asleep. top agrees (this was a second run, so the PID differs); its #TH column shows 5 threads, 4 of them running:
top -l 2 -s 3 -pid 12345 -stats pid,command,cpu,thPID COMMAND %CPU #TH
47044 spin4 400.1 5/4As always with top -l, read the last sample: the first one is printed before there is anything to compare against.
% CPU vs the CPU Load graph
Activity Monitor uses both scales in one window, which is where the confusion usually starts:
- The % CPU column is per core, like
top. Our test program reads about 400% there. - The panel at the bottom of the CPU tab, System, User, Idle and the CPU LOAD graph, is the whole Mac, scaled so that every core busy is 100%. The same program adds only about 25% there, because 4 busy cores out of 16 is a quarter of the Mac.
top's header lineCPU usage: ... user, ... sys, ... idleuses the whole-Mac scale too.
To see the cores one by one, choose Window > CPU Usage or Window > CPU History in Activity Monitor.
Irix mode and how to get a 0–100% number
Per-core percentages are called "Irix mode", after the Unix that used them; dividing by the number of cores is "Solaris mode". On Linux, top switches between them with the I key. macOS's top has no such toggle, and Activity Monitor has no setting for it: both always show per-core numbers.
htop also shows per-core CPU% by default, but it has a second column, NCPU%, that is normalized by the number of CPUs. Add it from Setup (F2) > Screens. For a quick one-off, divide by hw.ncpu yourself: 400% on a 16-core Mac is 25% of the machine.
When it matters
A compiler, video export or a game using several cores is doing what you asked. It is worth a look when a process sits at hundreds of percent while you are not asking it to do anything, such as a browser tab or a background helper; that is the battery and the heat. If the whole Mac slows down while it happens, check whether it is also thermal throttling.
The easier way: GaugeMon
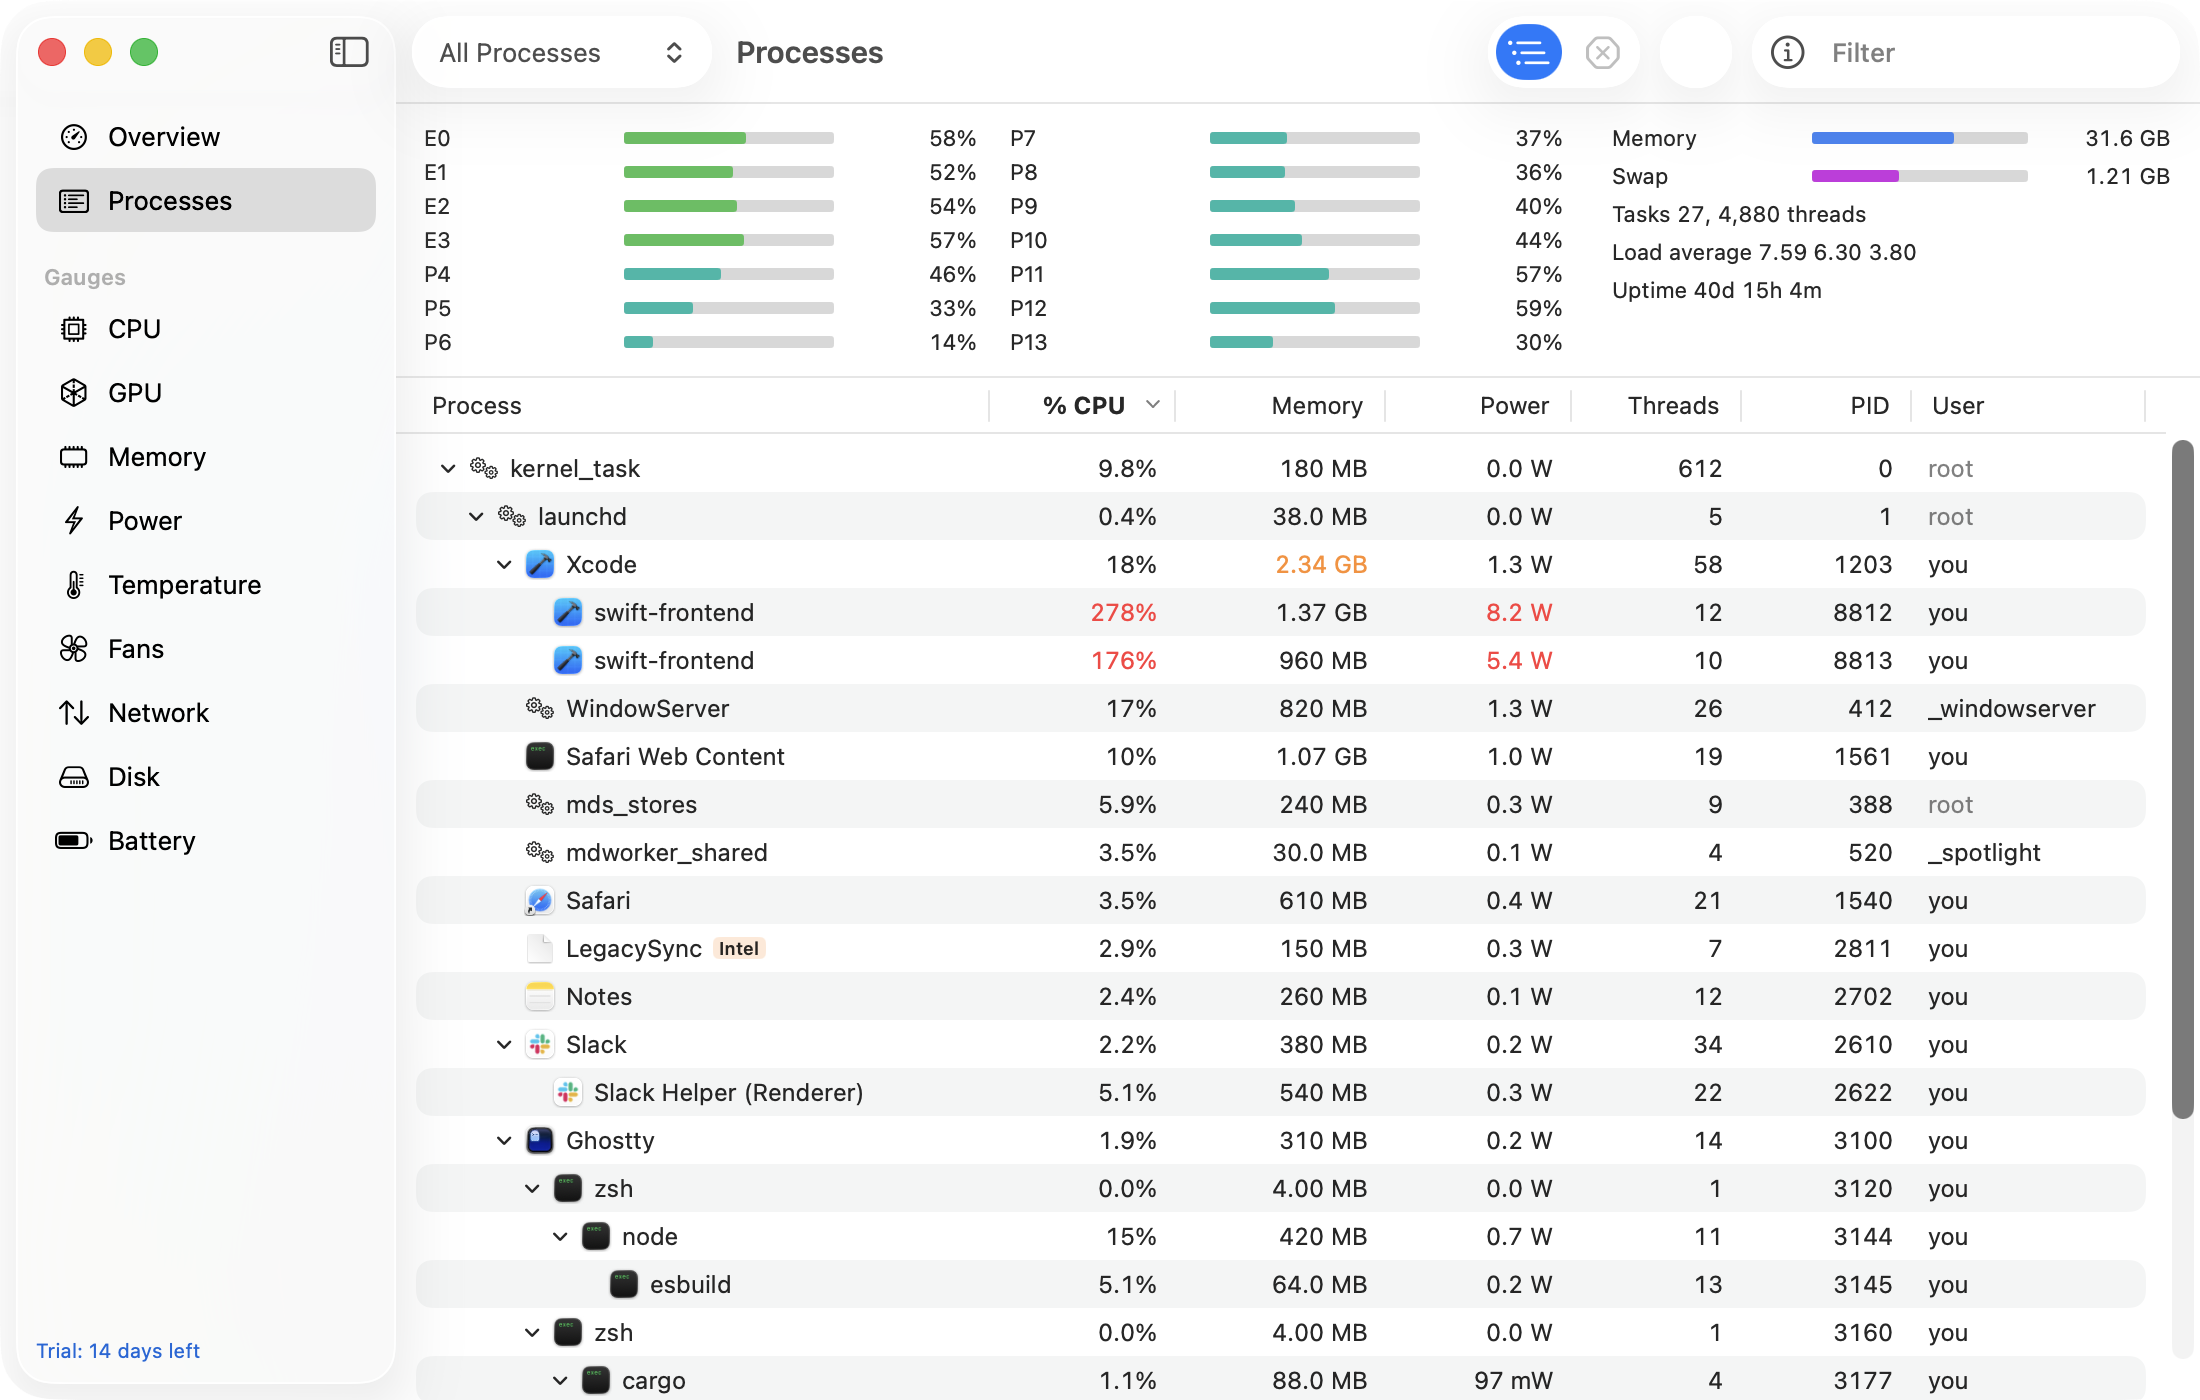
GaugeMon shows both scales without the confusion: the CPU gauge in the menu bar is the whole Mac from 0 to 100%, or per-core bars if you prefer, and its Processes window has an htop-style % CPU column per process, with per-core meters and load average above it. Click the CPU gauge for the P-core and E-core split and the top processes.