GaugeMon
Mac Performance Guide
Find which process is writing to disk on a Mac
Short answer
Run iostat -d -w 1 disk0 to see whether the disk is busy at all, then sudo fs_usage -w -f diskio to see which process is doing the reading and writing right now: every line is one disk I/O, and the last column names the process. Activity Monitor's Disk tab also lists processes by bytes written and read, but those are totals since each process started, not what it is doing now.
Is the disk actually busy?
On a Mac with one internal drive, that drive is disk0 (check with diskutil list internal physical). iostat needs no sudo:
iostat -d -w 1 -c 4 disk0 disk0
KB/t tps MB/s
15.79 663 10.22
4.01 7669 30.05
4.01 7474 29.24
4.96 8532 41.29The first row is the average since boot; ignore it. Each row after that is one second: tps is transfers per second and MB/s is reads and writes together. A few MB/s that comes and goes is normal background work. Tens of MB/s, second after second, with nothing obvious running, is worth chasing; the sample above, 30 to 40 MB/s every second, is one of those. Drop disk0 to see every disk, or drop -d to add CPU and load average columns.
Which process, right now: fs_usage
fs_usage ships with macOS and traces file system activity as it happens. It needs root. The diskio filter limits it to I/O that actually reaches the disk, and -w uses the wide format so paths and process names aren't cut off:
sudo fs_usage -w -f diskioEach line is one I/O. RdData and WrData are file contents, RdMeta and WrMeta are file system metadata, and the path tells you what file is involved. The last column is the process. Press Control-C to stop. Two variations that help:
# run for 10 seconds, then exit
sudo fs_usage -w -f diskio -t 10

# only one process (by name or PID)
sudo fs_usage -w -f diskio mds_stores
The output scrolls fast on a busy Mac. Redirect it to a file (> /tmp/io.txt) and look for the process names that fill it. For a per-process summary instead of a stream, powermetrics can add disk I/O to its task list:
sudo powermetrics --samplers tasks --show-process-io -n 1Activity Monitor's Disk tab
Open Activity Monitor, choose the Disk tab and click Bytes Written to sort. The bottom of the window shows reads and writes per second for the whole Mac, which is the same question iostat answers. The per-process columns are cumulative: a daemon that started at boot three weeks ago can sit at the top with hundreds of gigabytes without writing anything today. To spot the process that is busy now, watch which numbers keep climbing between refreshes, or use fs_usage.
What about iotop?
macOS still ships /usr/bin/iotop and /usr/bin/iosnoop, but they are DTrace scripts from the Solaris days, and System Integrity Protection, which is on by default, restricts DTrace. On macOS 26 without sudo, iotop stops here:
dtrace: system integrity protection is on, some features will not be available
dtrace: failed to initialize dtrace: DTrace requires additional privileges
Don't turn SIP off to get them working. fs_usage and powermetrics answer the same question without it.
The usual suspects
- mds_stores, mds, mdworker_shared: Spotlight indexing, heavy after an update, a migration or a big batch of new files. See mds_stores and Spotlight using high CPU.
- backupd: a Time Machine backup.
tmutil statusshowsRunning = 1while one is in progress. - kernel_task: among other things, the kernel writes swap. Constant writes with memory pressure in the yellow mean the Mac is short of memory; see High swap usage on Mac.
- bird, cloudd, fileproviderd: iCloud Drive and other file provider sync, busy after you add or download a lot of files.
- photoanalysisd, photolibraryd: Photos importing or analysing a library.
- com.apple.Virtualization.VirtualMachine: a virtual machine using Apple's Virtualization framework, such as Docker Desktop's. The I/O happens inside the VM, so look there for the real culprit.
- Build tools:
swift-frontend,clangandldduring an Xcode build write to DerivedData; a watcher or bundler that rebuilds on every save can keep the disk busy all day.
The easier way: GaugeMon
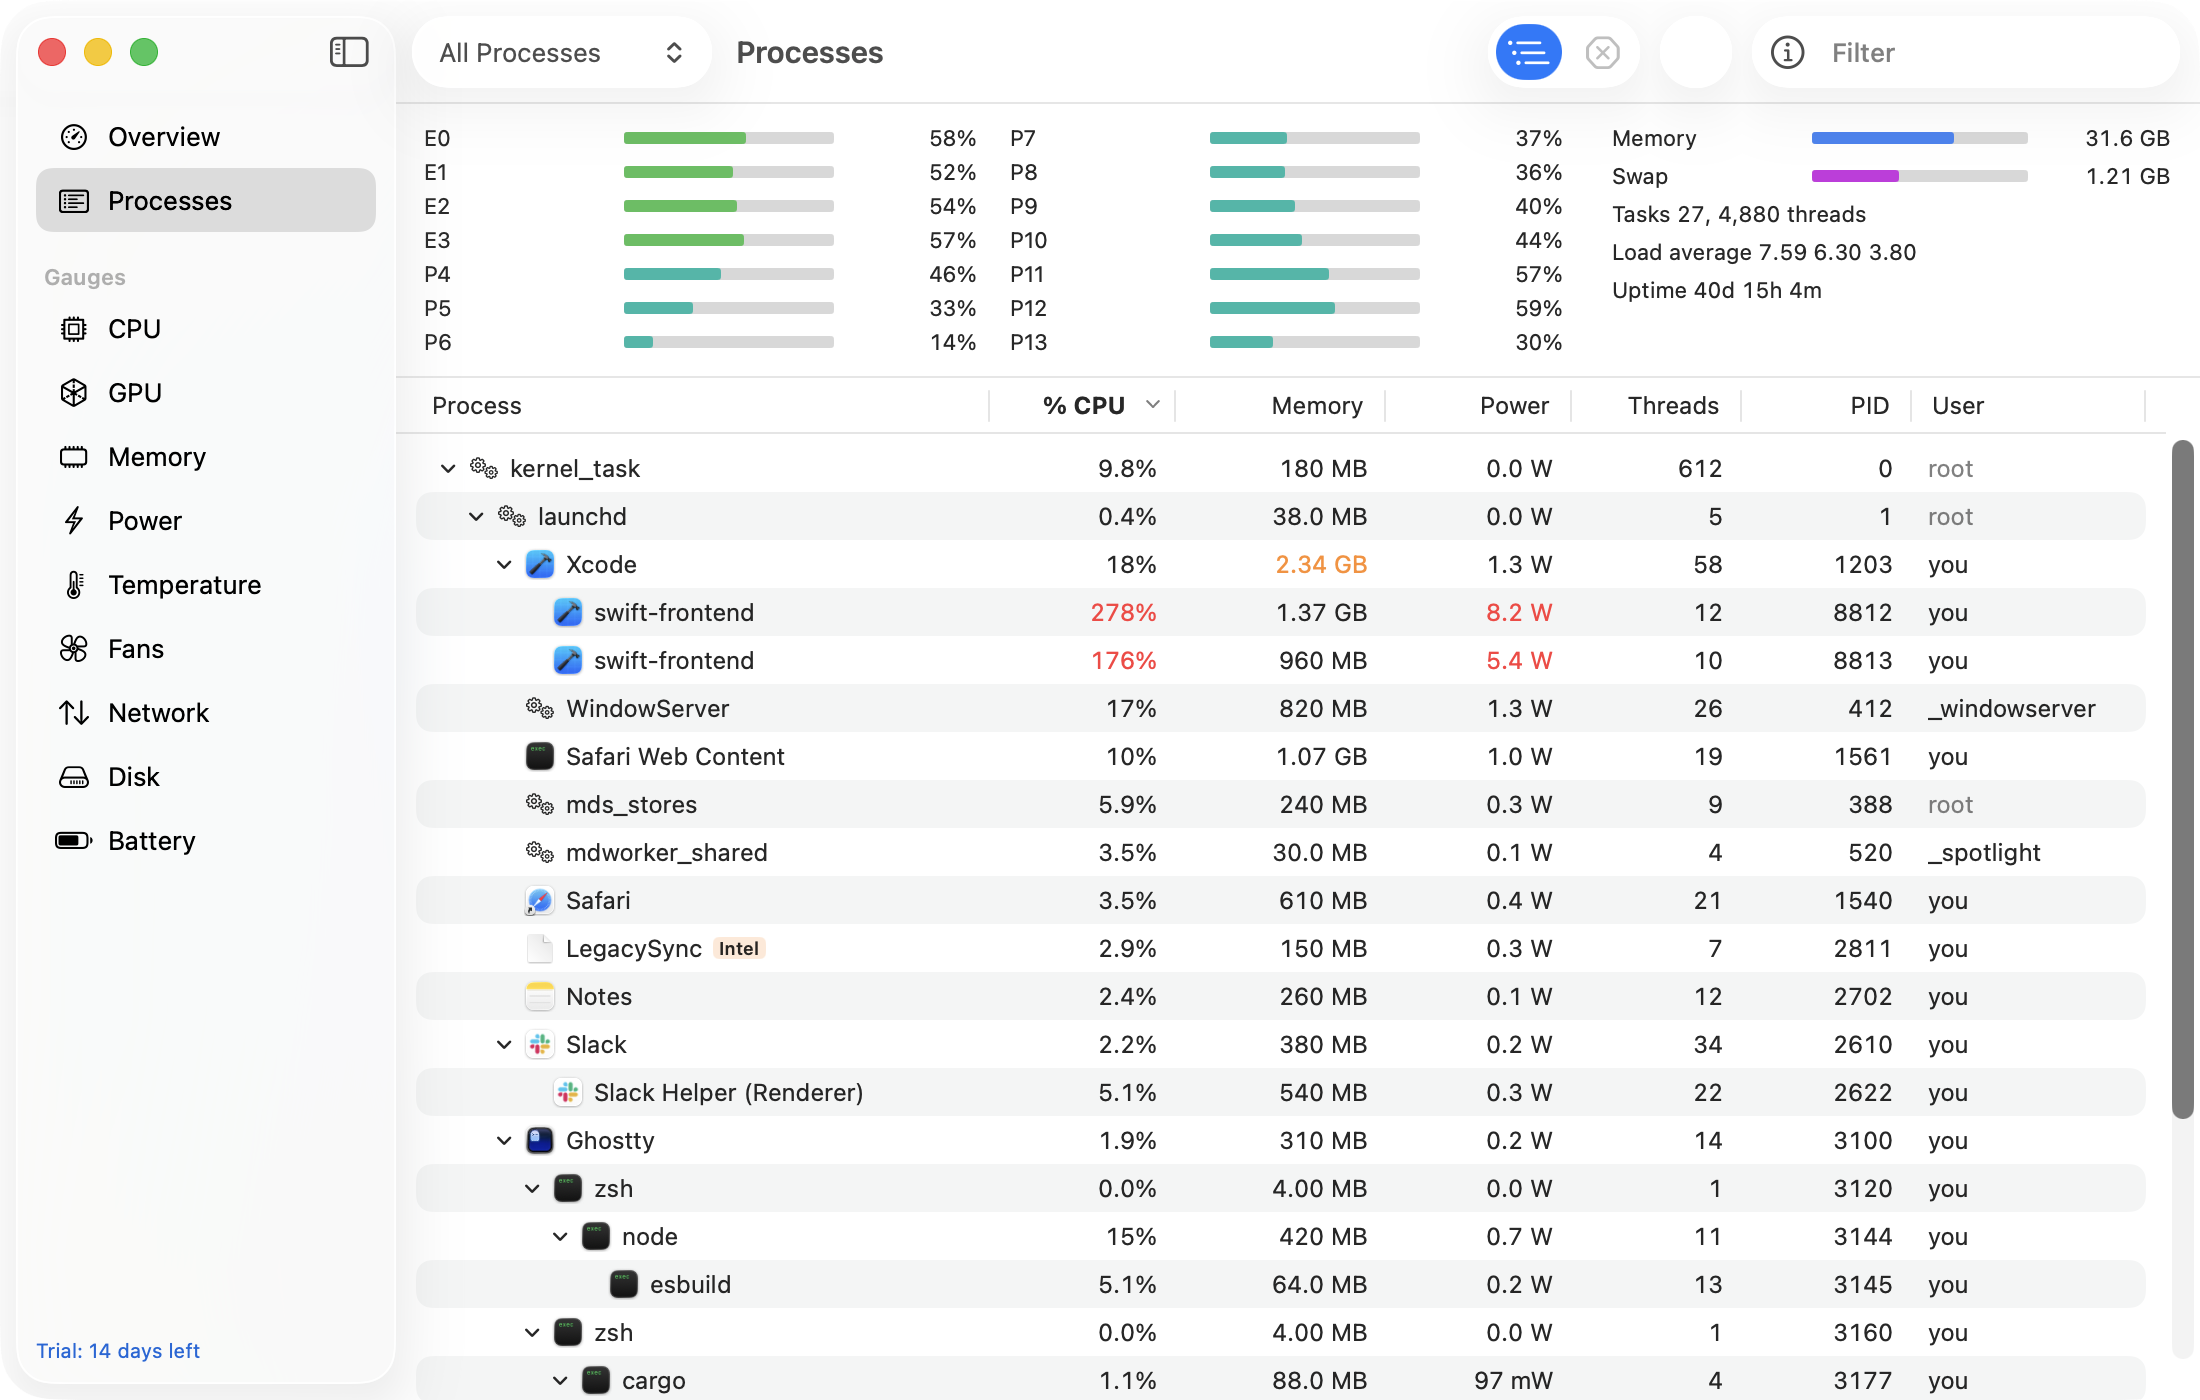
GaugeMon's Disk gauge shows read and write throughput for the whole Mac in the menu bar. Click it for a chart of the last 10 minutes and the top five processes by disk I/O. In the Processes window, right-click the column headers to turn on Disk Read and Disk Write, per second rather than since launch, and sort by either. Without the optional helper those columns are filled in for your own processes only; install the helper from Settings to fill them in for root's daemons too, such as mds_stores and backupd.